Overnight reversal higher, yet still downside exposed.
News:
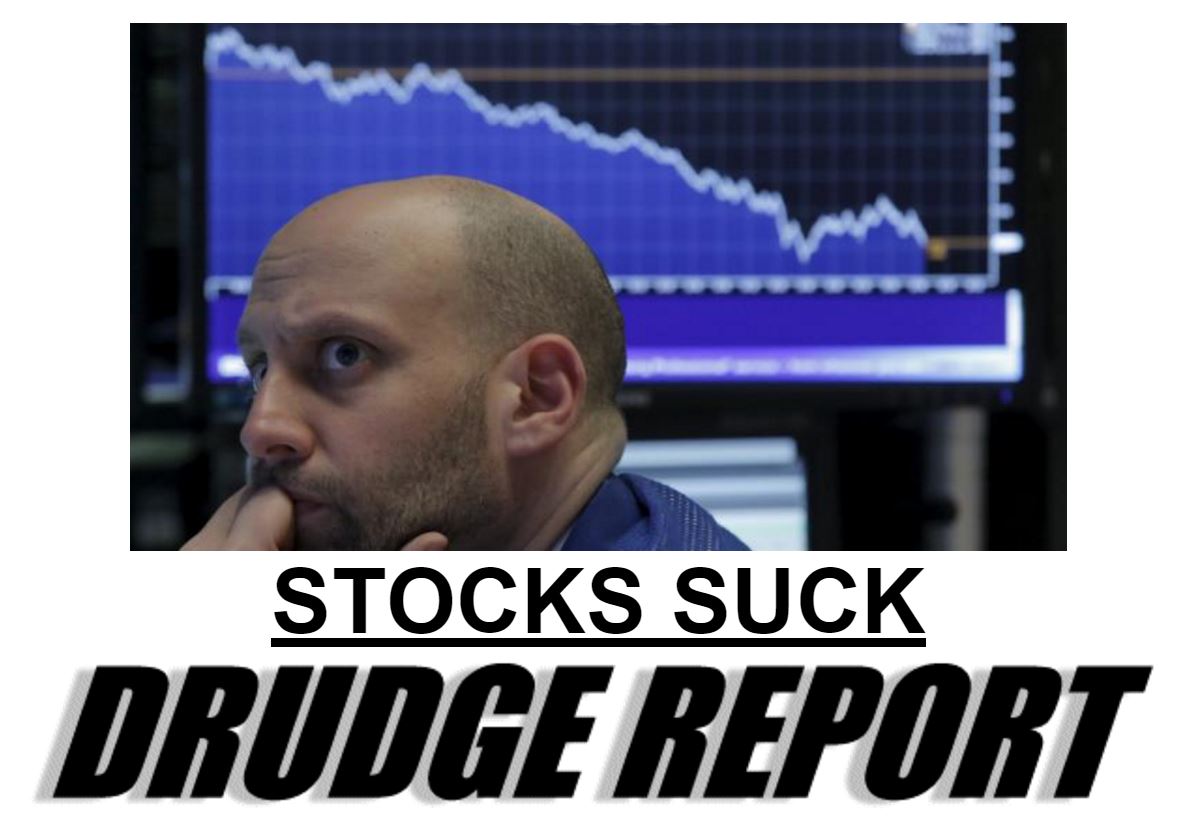
Have never seen a more negative headline from Drudge in the past 4 years of daily monitoring.
Reuters -- Chinese investors flee the stock market
Yet Shanghai Composite rose nearly 2%.
"Sell it all" appeared in two headlines this morning on Marketwatch, not as a recommendation mind you, but as accidental subtext.
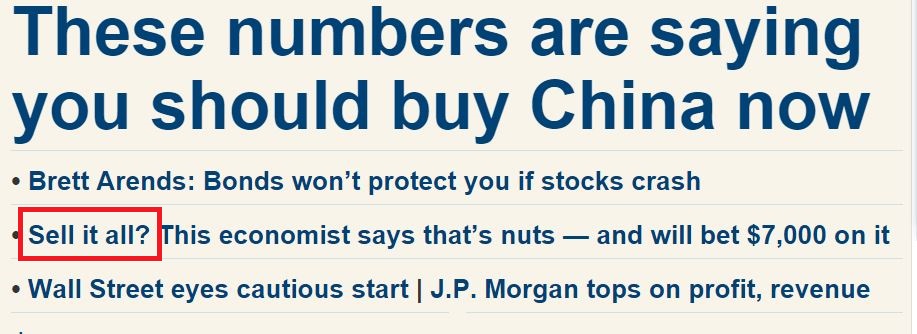

Granted, neither suggest capitulation yet, but simply that the urge to "sell it all" is creeping in.
German GDP rose 1.7% yet the DAX is cratering, possibly on fears of no further stimulus. Yet it's seeing firmness in EUR.
Interestingly, Asia had a rough night with China being the sole bright spot. Europe is red.
St Louis Fed president Bullard just spoke and sounded a little freaked out by low inflation, which he called "worrisome." This is code for deflation, and could mean the Fed is considering reversing the recent rate hike and staying lower for longer.
FX:
EUR firm on no new policy commitments from the ECB. Elsewhere, pretty benign thus far in FX land.
Treasuries:
Still appear to need a rest.
Energy:
WTI crude loving Bullard. NG taking a massive digger.
Careful on oil. Front page USA Today: Analysts -- Gas to remain bargain in 2016
Metals:
Gold looking a bit precarious. Silver giving back much of its huge rip higher yesterday. Copper higher.
S&P Outlook:
Blown opportunity yesterday. Hints of capitulation creeping in. Negative ticks exploded. Everyone wanted out. Given Bullard's comments above, shorts could get nervous.
Don't ever forget that intraday, surprise rate cuts, are a reality. They have happened before and will happen again.
Conversely, more and more pressure is being applied to the 1867.01 lows. Broader indexes such as New York Composite, Wilshire, and Russell 2000 have broken their equivalent, while the strongest one is the narrowest one: the Dow Jones Industrials.
Meanwhile TRIN suggests investors are fast asleep.
More and more I am considering a break of 1867 and what it could mean. Check out this arithmetic chart of the S&P monthly. (Many people prefer logarithmic charts, but I don't really "get" them. Many people also prefer exponential moving averages; I use simple moving averages to keep things as simple as possible.)

Continuing to look for REBOOT to reach the mainstream.
No comments:
Post a Comment