Modest follow through from Friday's recovery bounce.
News:
From a social mood standpoint, at what point in time would you except to see the following?
 |
| photo: hkfoodiexblogger |
 |
| photo: Oh, Bite it! |
 |
| photo: ibrewcoffee |
 |
| photo: kalatoast |
 |
| source: reddit.com/r/wallstreetbets/ |
 |
| source: solen.info/solar/ |
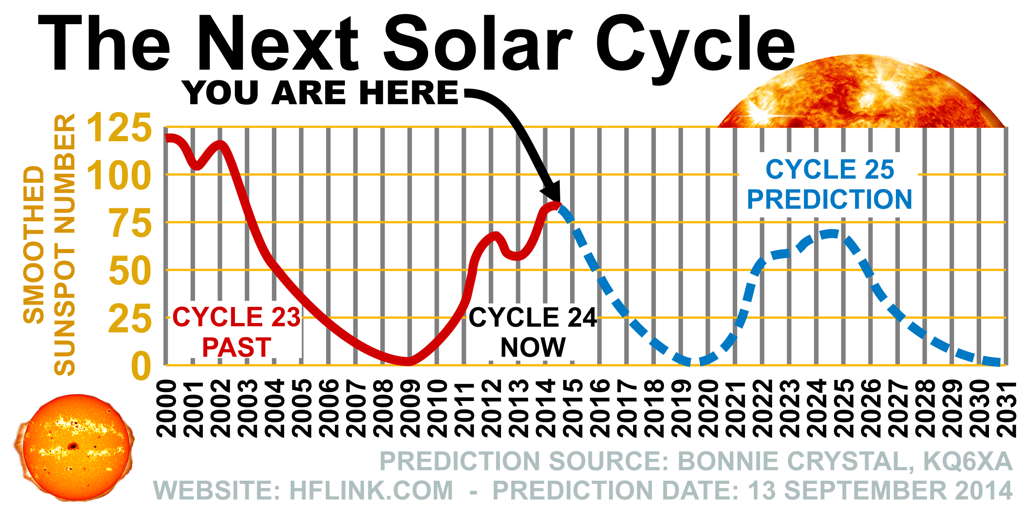 |
| source: hflink.com |
If we are just past the peak of SC 24, the ramifications for the markets (and the weather) could be enormous.
 |
| source: english.alarabiya.net/en/webtv/reports/2016/01/28/Heavy-snowfall-in-Saudi-Arabia.html |
FX:
Tepid day so far except for GBP and JPY. Both weaker.
Heard some more USD comments Friday from the trader I like to fade:
"Dollar's going down the tubes...it's just wrecked."
Yet even with Friday's weak NFP number (which blew the Fed rate hike odds to smithereens), USD remains well above its May lows.
Treasuries:
Slight give back from Friday's massive rally.
Energy:
WTI crude rallying from recent chop. NG as well.
Metals:
Continued rallies across the board.
S&P Outlook:
Friday was a mess. The S&P failed to join the Risk On party, and that could be a warning sign.
Posted this chart intraday on Friday with the thought that X may have completed, or may do so soon. This chart was drawn a while back and should not be used for timing. It was simply drawn for clarity.

X waves are similar to B waves. There's no reason why X can't continue a bit higher, sucking in more bulls. Both waves are "phonies" according to the Elliott Wave Principle by Frost & Prechter.
In fact, EWP says that if an analyst ca say that "there is something wrong with this market," chances are it's a B wave.
Or, by extension, an X wave.
The market is in a zone where I simply feel better with puts. Haven't sold everything yet from the long side, but am steadily moving toward just call options for continued upside speculation.
That said, if 2111.05 is exceeded, that will be a near-term stop for me to reassess. It does not have to take long.
No comments:
Post a Comment